Partial dependance plots#
Partial dependence plots are a visualization tool that help to show the effect of one (or two) features on the predicted outcome of a model, while averaging out the effects of all other features. They are used to interpret the behavior of complex models by isolating the relationship between the selected feature(s) and the target variable.
Partial dependence plots are useful for understanding black-box models like deep neural networks or ensemble methods such as random forests and gradient boosting machines. They can be used to:
better understand the model behaviour;
identify trends between the target variable and the feature under analysis (e.g., linear, monotonic, or more complex);
and identify interactions between two features (when using a 3D plot).
There are, however, some limitations to partial dependence plots:
they assume independance between the features, which is not always the case in real datasets;
although they can show interactioon between 2 features (in a 3D plot), they are unable to capture more complex interactions (among 3+ features).
Implementarion in scikit-learn#
Partial dependence plots can be created using the sklearn.inspection.PartialDependenceDisplay class if one only whishes to obtain the plots:
from sklearn.ensemble import GradientBoostingRegressor
from sklearn.inspection import PartialDependenceDisplay

# x_train, y_train are the features (X) and target variable (Y) in the dataset
model = GradientBoostingRegressor(random_state=0)
model.fit(x_train, y_train)

features = [5, 12]  # These are feature indices based on the dataset
PartialDependenceDisplay.from_estimator(model, x_train, features)
or, alternatively, using sklearn.inspection.plot_partial_dependence if one wishes to get the raw values of the partial dependence function:
from sklearn.inspection import partial_dependence

results = partial_dependence(model, x_train, [0])
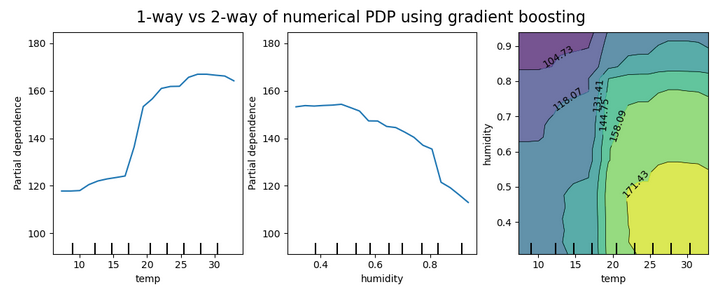
Example partial dependence plots are shown in the figure below. The first two plots show 1-way dependence and the right-hand figure shows a 2-way dependence.

Another type of partial dependance plots are individual conditional expectation (ICE) plots.
